The idea started in 2011. There are many directions we could have gone, so how did we end up with this solution? Over 40 investigators have helped us understand the problems and refine our approach, from initial observations, interviews, and surveys to concept testing and eventually through beta testing. Here's why the DataSpace is what it is.
In 2010 the Global HIV Vaccine Enterprise called for a "dramatic shift in the culture and practice of sharing research data," recognizing that the disease and immune responses are so complex that progress depends on faster and better ways to learn from each other's work. The Bill & Melinda Gates Foundation provided funds to build a proof of concept and later to launch at the 2015 CAVD Annual Meeting.
When we started talking to you (our prospective users) we were amazed at the ideas and questions you could rattle off, but with no easy way to explore them due to problems of access and annotation detail. We had many ideas for how we could help. We discussed having algorithms automatically find new correlations, inventing a new interactive publication format, public participation, focusing on the data upload experience, and more.
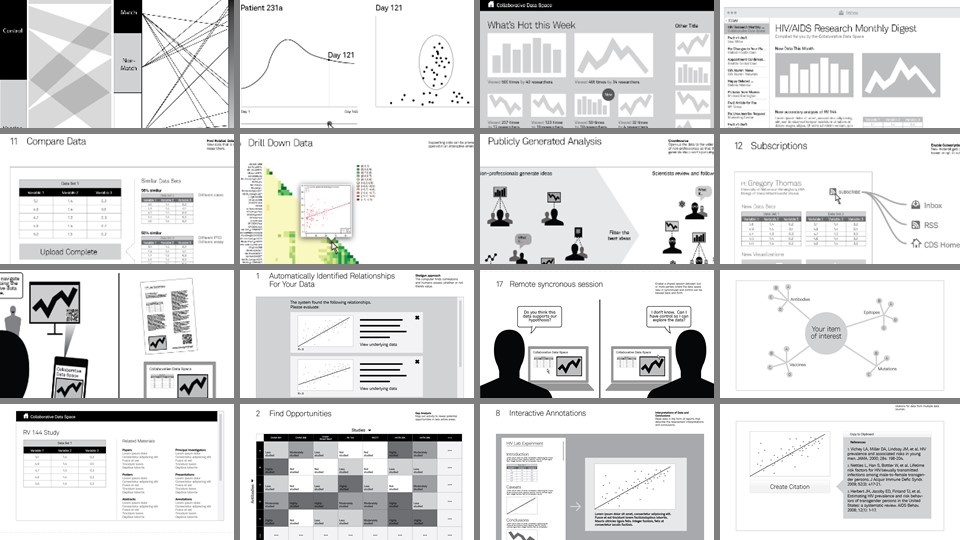 Early ideas discussed with investigators.
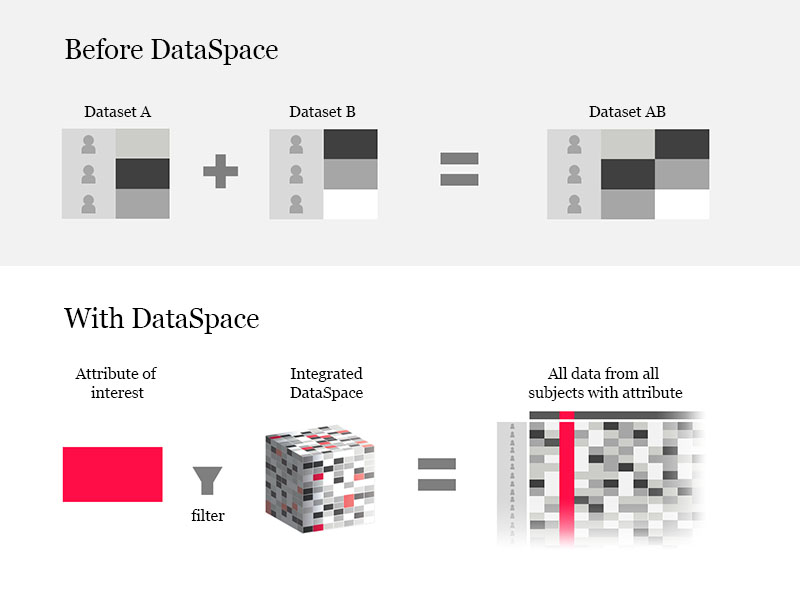
You told us the biggest knowledge gaps and most exciting ideas involved data from more than one assay or study, to which few people have easy access. And you told us that requesting data today can require membership, approval, and a back-and-forth process with analysts to find out exactly what data exist and what can be asked of them. Then, for each question, a tax is paid to bring data from different sources together, align it by visit and subject ID, and resolve conflicts of naming and structure.
Our goal became to pay this tax once, centrally and upfront, to give you far easier self-service exploration for any number of questions and ideas afterwards. Our work with you led us to believe that as the barriers go down, more questions of all sizes can be answered, leading to new ideas. So we dug through portals, SharePoint, and archives to bring together subject-level data and began working to harmonize it and create a comprehensive schema. We organized it by studies' subject IDs so that you start with all the data rather than building it up with queries. Instead of looking for "datasets" and combining them, you define what you're interested in and get all the data we have from all related sources.
We also discovered that while investigators hold an amazing amount of information in their heads, no one can remember every detail of hundreds of studies, assays, and products. Details can be critical to form an idea or interpret data. So we compiled these details into pages, filling gaps and smoothing inconsistencies wherever possible, and used them to create the Learn section of the DataSpace. We will always be working to improve the information, but we think it's already the best source available.
Now we had to decide what it should be like to use. Should we start with an R interface? Ask you to write SQL queries? As we talked through the scientific scenarios of interest with different stakeholders, we realized that it can be difficult to form a valid question without interacting with the data. Often there is a gap between an initial question and the nature of the data available to help answer it. The question may need to be modified based on a detail of study protocol or assay setup. And the answer may not be as expected, leading to additional questions or an unexpected insight.
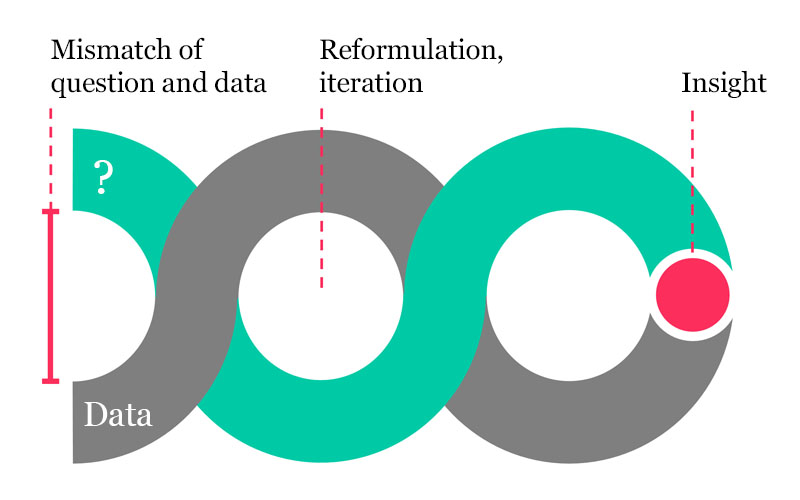 Forming a question and finding the right data are braided processes.
This is how the DataSpace got its visualization tools – Find Subjects and Plot – which help you identify the data you need as you start to answer a question. Rather than make specific tools for each assay, we've emphasized simple views that work across all types and sources. This way you don't have to query or export multiple times when you realize you need something slightly different. And unlike generic visual tools like Tableau, we have added a lot of unique features specific to the HIV vaccine domain to help you work more effectively with the data. When you've got what you want you can export it to specialty tools, do stats, and share ideas with your collaborators.
What you see now is just a start! From the beginning, we have planned to be a resource across multiple vaccine networks to have greater impact. We hope you'll help us by suggesting improvements, telling us about how the DataSpace influences your work, and helping us expand. We have a long list of exciting improvements we'll be making regularly, as you can see from one of our prioritization sessions:
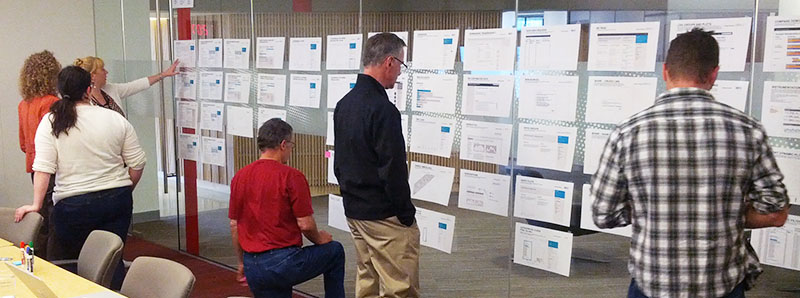 Prioritizing dozens of future features
Thank you to everyone in this community who has taught us, brainstormed, given feedback, and helped to test. The DataSpace is SCHARP, LabKey Software, and Artefact.

