A case study using data from DataSpace.
Here, we illustrate a sample size calculation using data from the CAVD DataSpace. In this study, our objective was to estimate sample size for a SOSIPv4.1 trimer vaccine study, CAVD 641, comparing the following adjuvants: Alum-3M052, administered via subcutaneous and intramuscular routes, versus GLA-LSQ administered via the intramuscular route. The outcome of interest was viral ID50 neutralization titer measured using the TZM-bl neutralization assay.
Preparation
Components of a power calculation
There are four levers that can be adjusted in a power analysis: 1) the sample size in each group; 2) the power, i.e., the probability of detecting a difference given there is one; 3) the significance level, i.e., the false positive rate; and 4) the effect size. For a two-sample t-test, the effect size is calculated as the difference in means between the two groups divided by a pooled standard deviation.
Our goal was to determine the minimum difference in mean ID50 that could be detected by varying power, sample size, and standard deviation of ID50. For power, we examined two levels: 80% and 90%. For sample size, we examined values ranging from 3 to 12 based on study design constraints. For standard deviation, we explored values from a recent study, CAVD 499, available on DataSpace. The significance level was fixed to 0.05 for all calculations.
Accessing DataSpace
Standard deviation is a critical component of effect size, and so we used historical data to inform what we might expect in future studies. Using DataSpace, we find that CAVD 499 also compared adjuvants across similar protein-adjuvant regimens.
Data in DataSpace can be accessed through the Export feature or via the new DataSpaceR API (see the DataSpaceR GitHub page for information on installing and using this R package). From there, we can access the CAVD 499 neutralizing antibody (NAb) and Demographics datasets. For the calculation, we used week 14 immunogenicity data to match investigator specifications. We then collated relevant summary data from the following 3 vaccine groups:
-
Alum (Group 1).
-
HIV-1 gp140 with adjuvant Alum + 3M052 given subcutaneously (Group 5).
-
The best performing vaccine group (highest titer across isolates).
The best performing vaccine group provides additional information regarding expected observed differences in titers and variability.
Next, we calculated geometric means and standard deviations of the ID50 titers for each of the 3 vaccine groups. Those results are summarized in the following table:
Table 1: Log10 ID50 Summary Statistics from CAVD 499
|
study_arm |
study_product_combination |
antigen |
N |
mean_titer |
sd_titer |
|
1 |
1086.C gp140 trimer subunit protein & Alum |
MN.3 |
6 |
2.20 |
0.17 |
|
1 |
1086.C gp140 trimer subunit protein & Alum |
MW965.26 |
6 |
2.87 |
0.16 |
|
1 |
1086.C gp140 trimer subunit protein & Alum |
SF162.LS |
6 |
1.70 |
0.23 |
|
5 |
1086.C gp140 trimer subunit protein & Alum (GLA) & Alum (3M052) |
MN.3 |
6 |
3.27 |
0.39 |
|
5 |
1086.C gp140 trimer subunit protein & Alum (GLA) & Alum (3M052) |
MW965.26 |
6 |
4.17 |
0.31 |
|
5 |
1086.C gp140 trimer subunit protein & Alum (GLA) & Alum (3M052) |
SF162.LS |
6 |
3.04 |
0.48 |
|
6 |
1086.C gp140 trimer subunit protein & PLGA (GLA) & PLGA (3M052) |
MN.3 |
6 |
3.69 |
0.24 |
|
6 |
1086.C gp140 trimer subunit protein & PLGA (GLA) & PLGA (3M052) |
MW965.26 |
6 |
4.47 |
0.27 |
|
6 |
1086.C gp140 trimer subunit protein & PLGA (GLA) & PLGA (3M052) |
SF162.LS |
6 |
3.23 |
0.35 |
Using the historical data (Table 1), we chose a moderate and large standard deviation for our calculations: the median (approx. 0.3) and an overall upper bound (0.5).
Sample size calculations and results
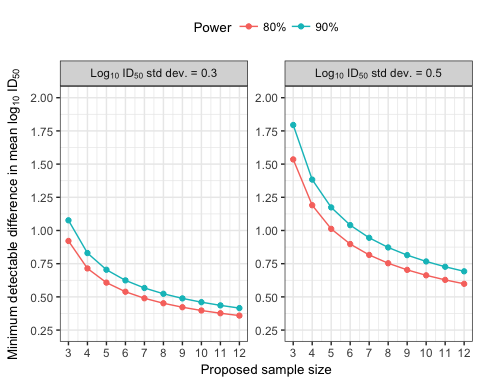
We cycled through the proposed ranges of standard deviations, power, and sample sizes to calculate the minimum detectable difference in mean log10 ID50 for each combination of values.
Figure 1 visualizes the results from these calculations. Based on those results, the CAVD 641 study was designed with 8 animals in each group. Assuming a standard deviation of 0.3, there was a 90% power to detect a 0.5 log10 (approx. 3-fold) difference in mean ID50 neutralization titers using 8 animals in each group.
Figure 1: Minimum detectable differences in mean log10 ID50 neutralization titers for varying sample sizes.


