Updates
New data uploads - November 2017

Data has been uploaded for 3 Ph I/II clinical trials, 7 NHP studies, and 3 other animal studies including: Click on the study page links below for Protocol Team reports, data summaries, and more details about the studies. Name & Description Data Added Type PI Strategy CAVD 256 (EV03/ANRSVAC20) is Phase I/II study to compare the immunogenicity and safety of 3 DNA-C prime followed by 1 NYVAC-C boost to 2 DNA-C prime followed by 2 NYVAC-C boost BAMA Phase I/II Pantaleo Combo: DNA… Read more
Pantaleo CAVD 434/AUP 567 publication and data

CAVD 434/AUP 567 study results were published in the May 2017 issue of the Journal of Virology. Zurawski G, Shen X, Zurawski S, Tomaras GD, Montefiori DC, Roederer M, Ferrari G, Lacabaratz C, Klucar P, Wang Z, Foulds KE, Kao SF, Yu X, Sato A, Yates NL, LaBranche C, Stanfield-Oakley S, Kibler K, Jacobs B, Salazar A, Self S, Fulp W, Gottardo R, Galmin L, Weiss D, Cristillo A, Pantaleo G, Levy Y. Superiority in Rhesus Macaques of Targeting HIV-1 Env gp140 to CD40 versus LOX-1 in… Read more
DataSpaceR

As an alternative to the export feature in the Grid, we’ve created an R package that simplifies access to the DataSpace database. DataSpaceR is a custom version of the Rlabkey API that allows users to programmatically access specified datasets using R, a programming language for statistical computing and graphics. The DataSpaceR package is open source and can be downloaded and installed locally. DataSpaceR is coming soon! Watch for our upcoming blog and tutorial with… Read more
New data uploads - September 2017

Data has been uploaded for 7 more NHP studies, including: Click on the study page links below for Protocol Team reports, data summaries, and more details about the studies. Name & Description Data Added Type PI Strategy CAVD 281 (AUP 513) is a non-human primate study comparing NYVAC/ALVAC prime/boost regimens BAMA, NAB, ICS Pre-Clinical NHP Pantaleo Combo: Protein & vector vaccines CAVD 355 (CAVIMC-045) is a non-human primate study of protein and adjuvant regimens BAMA… Read more
What's new in the DataSpace - May 2016
When plotting assay data over time (e.g. by study days, weeks, or months), you have the option of plotting time as a continuous or categorical variable. Plotting time as a continuous variable shows a simple, clean distribution of data over time, whereas, plotting time as a categorical variable results in individual boxplots for each visit in Plot, which can make it easier to compare responses between visits. Now you'll see the study timeline (the icons showing the timing… Read more
What's new in the DataSpace - April 2016

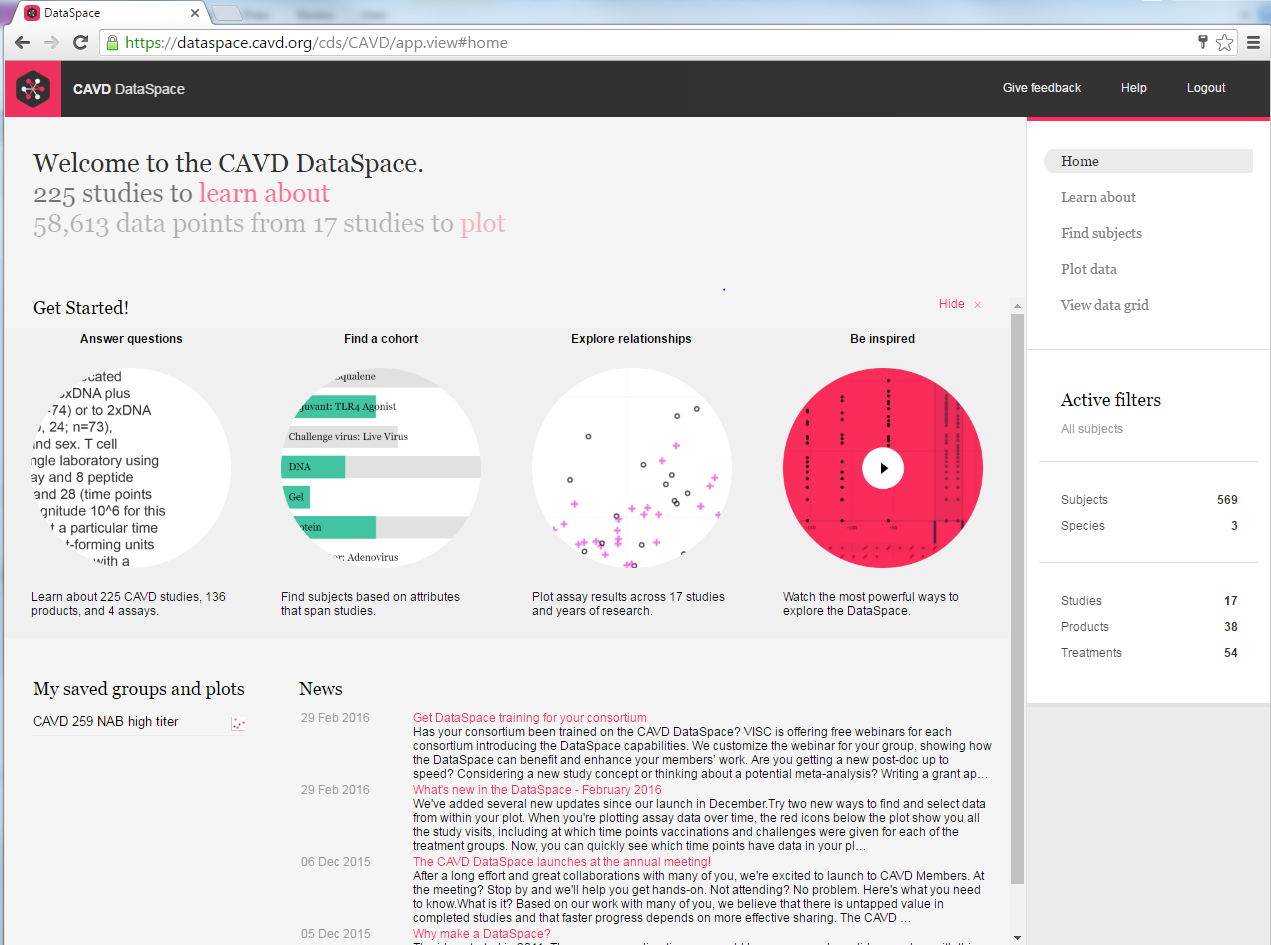
Need to know what assays were run in a study? Want to find data on subjects who received a protein-based vaccine? Or just want to take a quick look at responses at a given time point? The quick links will take you where you need to go. And don't forget the Getting Started video. It's a great place to begin your first session. You'll learn about the key features of DataSpace, hear about common use cases, and get inspired! When you plot assay results against time (e.g. study day) on the… Read more
What's new in the DataSpace - February 2016

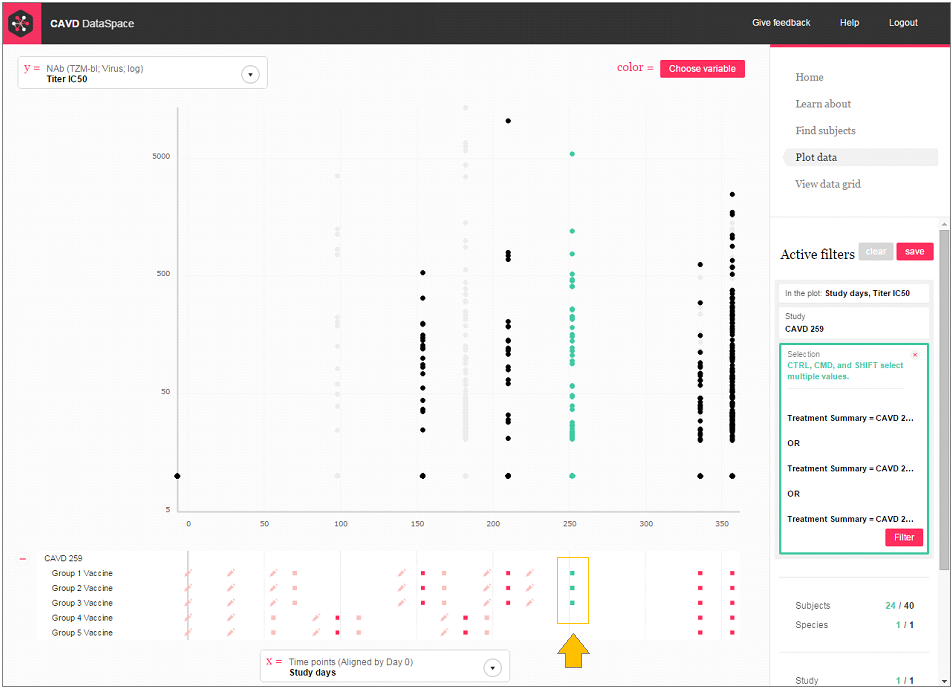
When you're plotting assay data over time, the red icons below the plot show you all the study visits, including at which time points vaccinations and challenges were given for each of the treatment groups. Now, you can quickly see which time points have data in your plot (the time points with data are a darker red). You can even click on the icons at the bottom of your plot to select and filter the groups and time points you want. You asked for 'em, you got 'em. We added over 160… Read more
